How LeDroit Park’s demographics have changed since 1970
Since 2000 the census tract that includes LeDroit Park has grown more educated, more expensive, and wealthier. Meanwhile the tract’s total population held steady after decades of slow decline. While the white population has increased, the census tract is still overwhelmingly black.
Governing Magazine recently ran a story on gentrification in DC and labeled Census Tract 34, which contains LeDroit Park and Howard University, as “gentrified“. LeDroit Park has certainly changed over the years and I finally got around to compiling decennial census data from 1970 to 2010 as well as data from the American Community Survey.
Let’s start off with the biggest changes.
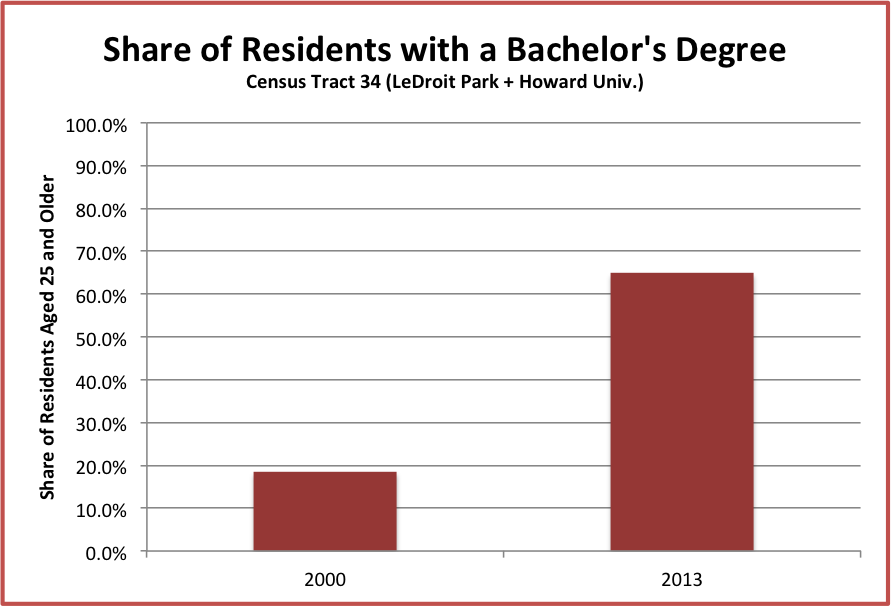
LeDroit Park is now better educated than the DC region and the nation
Data from Governing show that the share of adults age 25 and older who earned a bachelor’s degree more than doubled from 18.5% in 2000 to 64.9% in 2013. In fact the neighborhood catapulted over the regional figure (48%) and the national figure (28.8%).
Home prices fluctuate more drastically in LeDroit than in the rest of DC
Data from NeighborhoodInfoDC show that until 2004, the median sale price of single-family homes in the neighborhood moved closer to the average of the median values of all DC census tracts. The median price in LeDroit Park quintupled from 1996 to 2005, marking the greatest period of price appreciation. Though prices fell a bit from the recession, the neighborhood’s median price is slowly converging on the District-wide figure. (Disclosure: I do consulting work for the think-tank that produces NeighborhoodInfoDC)
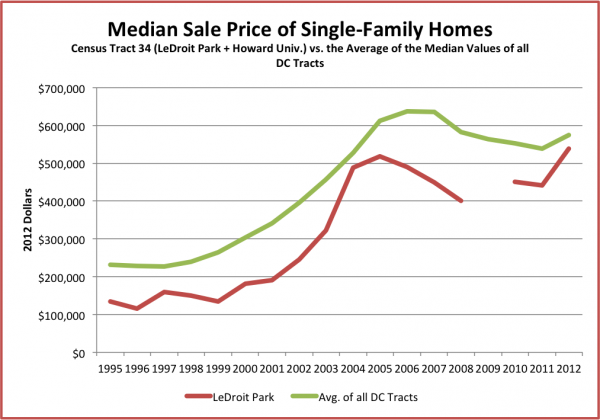
Note: 2009 data not available
Governing’s data of the median home value (both single-family homes and condos) show that housing prices nearly doubled from 2000 to 2013.

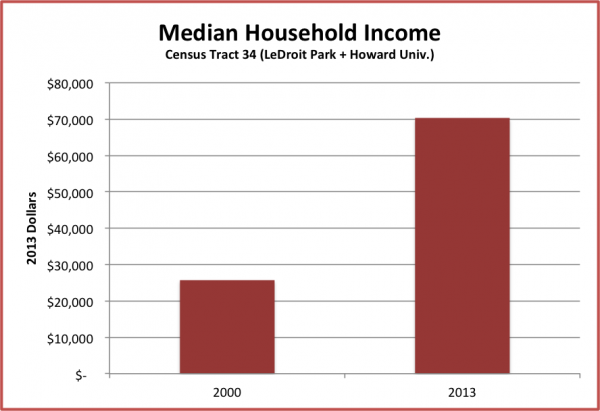
Median household income more than doubled from 2000 to 2013
(For comparison, median household income nationwide declined during this period.)
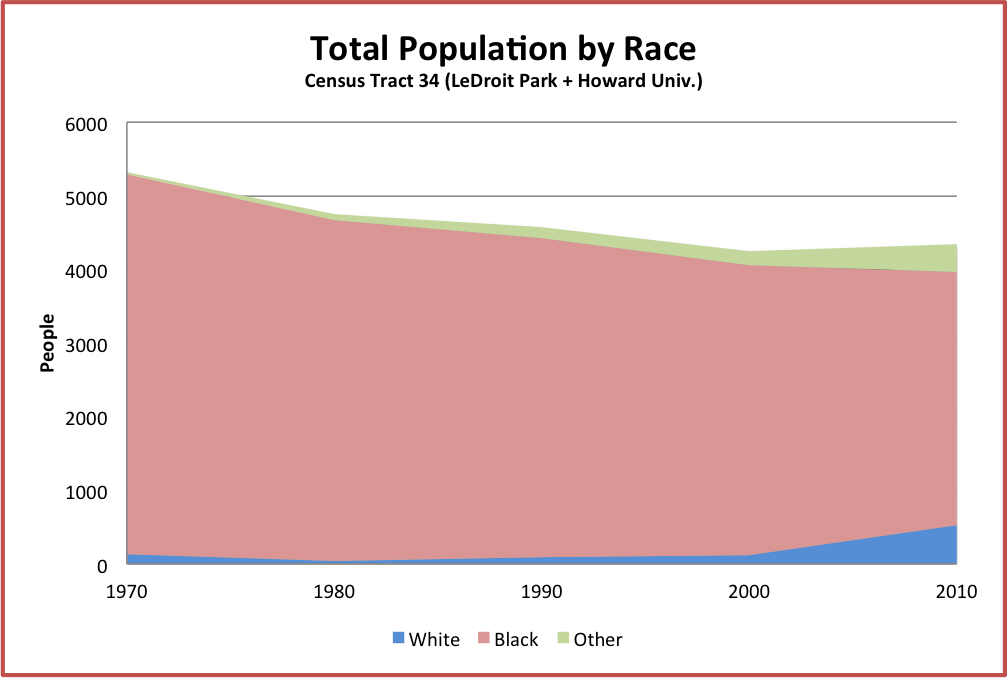
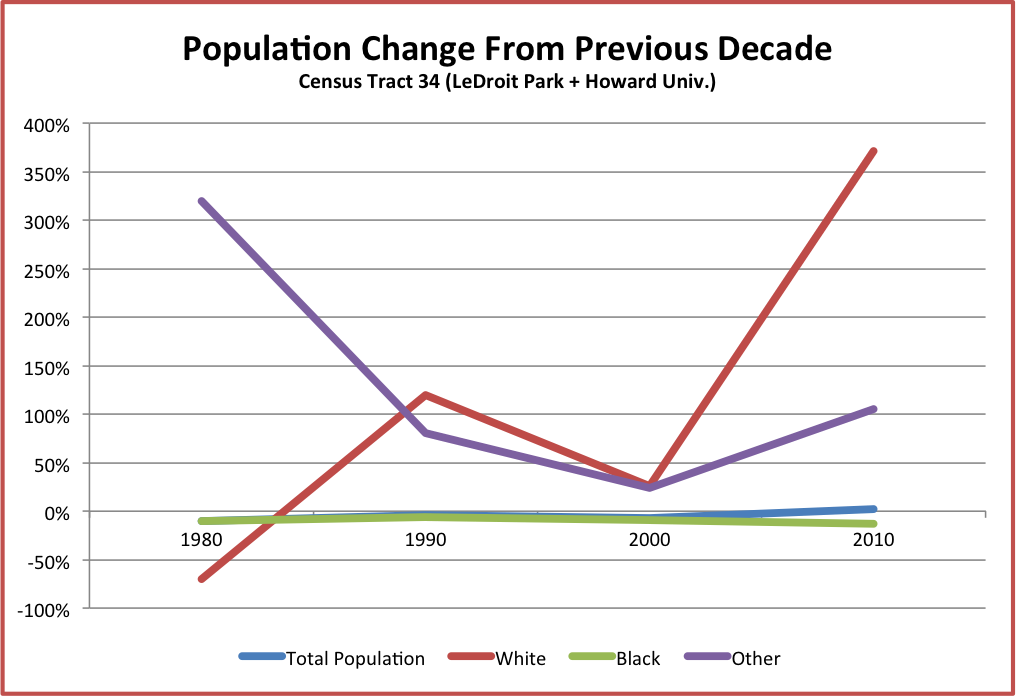
LeDroit Park is still predominantly black
The population of LeDroit Park and Howard’s campus held steady since 2000 after decades of modest decline. Though the number of whites more than tripled and number of blacks fell 13% from 2000 to 2010, our census tract is still 79% black. A few years ago I got a limited data set of the 2010 Census from the Office of Planning and was able to separate LeDroit Park figures from the rest of the census tract that lies north of W Street. Even then I found that the neighborhood was 70% black.
One popular gentrification narrative is that the process turns poorer black neighborhoods into wealthy white neighborhoods. While income and home values in LeDroit have soared, it still remains a predominantly black neighborhood.
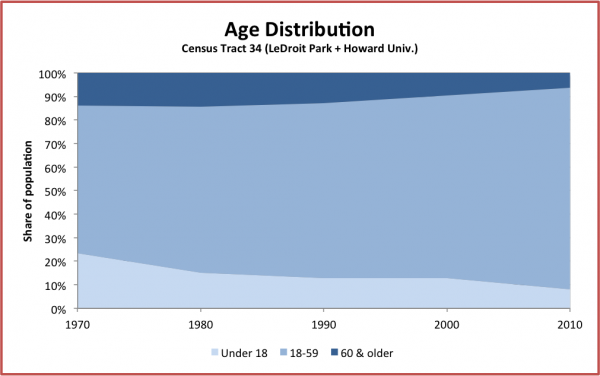
Lil’ LeDroiters are becoming scarcer
From 1970 to 2010, the population of residents under 18 tumbled from 23% of the population (1,244 children) to 8% of the population (350 children). For comparison, DC’s under-18 population in 2010 stood at 17%.
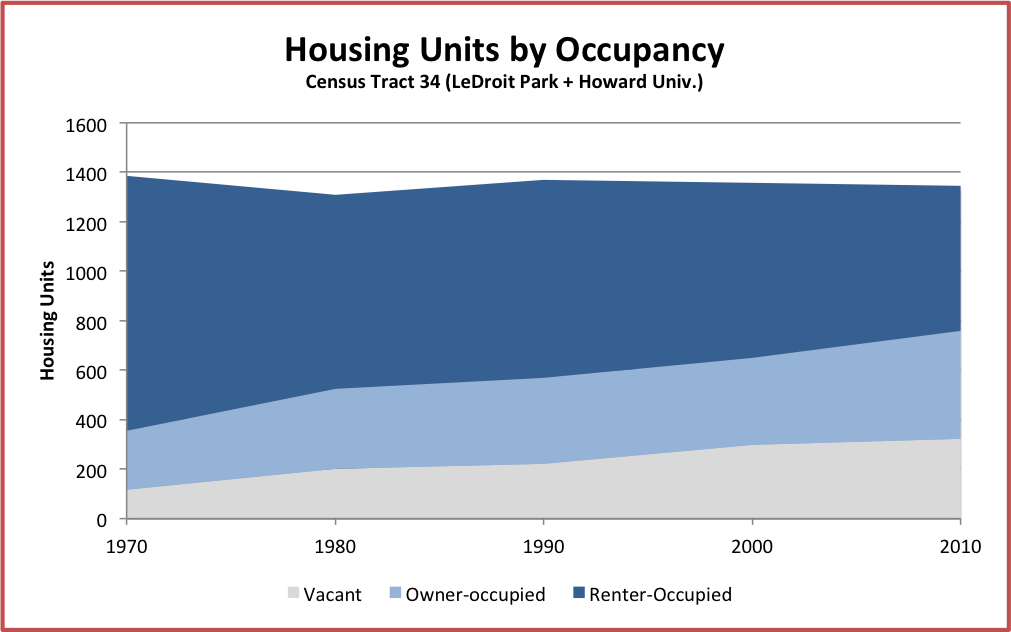
Homeownership has expanded, the housing stock has not
This was one of the more surprising facts. Despite construction of numerous infill rowhouses (especially on the 300 and 500 blocks of U Street) and despite the conversion of many one-unit rowhouses into two-unit rowhouses, the total number of housing units is slightly lower than in 1970. Also, vacancy has been rising, which contradicts what I have seen since I moved here in 2009. Perhaps the vacancy numbers were driven by the remodeling of the 161 units at Kelly Miller or perhaps Howard University dorm rooms do not count as “occupied” since many are vacant during the summer.
The definition of gentrification is a matter of great debate, but Governing defined it as any census tract that met the following criteria from the 2000 Census to the 2010 Census:
- It must start out poorer, i.e. “median household income and median home value needed to fall within the bottom 40th percentile of all tracts within a metro area at the beginning of the decade.”
- It must end up pricier and more educated, i.e. “in the top third percentile for both inflation-adjusted median home values and percentage of adults with bachelors’ degrees.”
According to Governing’s analysis, our tract, like half of the other DC tracts that met the first condition above in 2000, satisfied the second condition in 2010 and thus gentrified.
Sources:
- Longitudinal Census Bureau data (1970 – 2010) came from the US 2010 project, which used a peer-reviewed method adjust older tract data to conform to the latest tract boundaries.
- Governing, which used Census Bureau data.
- American Community Survey, a Census Bureau project that collects detailed demographic data for years between and overlapping each decennial census.
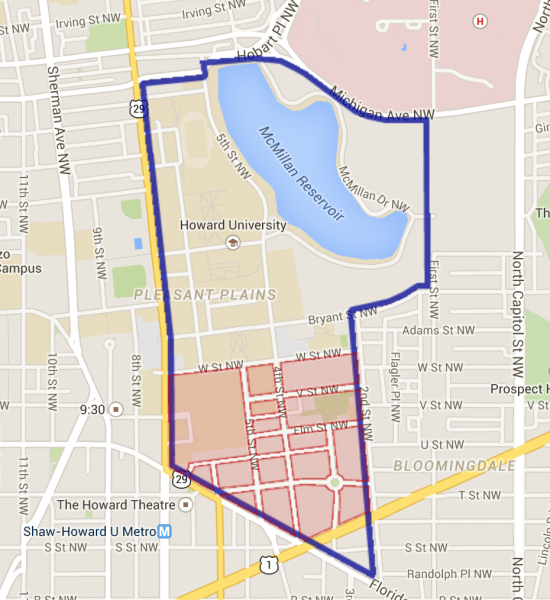
Our census tract (outlined in blue) is larger than the neighborhood and includes much of the Howard University campus.
Our zip code, now with some more white people
Every now and then the Census Bureau or some organization releases a report or new data showing that DC’s demographics changed. A recent analysis of census data found that the 20001 zip code, which covers LeDroit Park, Pleasant Plains, Bloomingdale, Truxton Circle, Shaw, and Mount Vernon Square, saw its non-Hispanic white population increase by 27.2 percentage points from 5.6% to 32.8%. In fact, 20001 made the list of “most-whitened zip codes” in the nation.
Our review of the 2010 census data found that LeDroit Park is 21% white, which is below the figure for the zip code.
What does this mean? Without more information, the report doesn’t mean much other than the unsurprising fact that neighborhood demographics change. This plain answer will dissatisfy some. In a city in which identity is inevitably intertwined with politics, many will feel compelled to read too much into the data for some larger narrative that confirms preexisting social or political views.
However, the reasons that people move into and out of a neighborhood are complicated and there are both push and pull factors, both voluntary and involuntary.
Why a person might leave a neighborhood:
- Your new spouse wants to live elsewhere.
- You graduated from the local university and intend to return to your hometown.
- You dislike too many of your neighbors.
- You got a new job far away.
- The rent has become unaffordable.
- You lost your job and can’t pay any rent.
- You want to retire closer to where your children live.
- Perceptions of crime.
- Divorce.
- Death.
- You want to send your children to school elsewhere.
- You’re pursuing a degree somewhere else.
Why a person might move into a neighborhood:
- You are born and that’s where your parents live.
- You found the perfect home.
- Friends and family are nearby.
- There are people like you nearby.
- You got a new job nearby.
- The area is familiar.
- You’re moving in with friends or relatives.
- Rent is cheaper here than in some other place.
- The neighborhood is visually appealing.
Each person’s story is different, but there is far more at work than the simplistic displacement narrative that gets so much press.
The 1940 Census reveals a full profile of LeDroit Park

U.S. Census records are kept confidential for 72 years, meaning that the 1940 Census went public yesterday. Whereas previous census ledgers were difficult to find online for free, the U.S. Archives released the full 1940 Census online. We have started perusing the pages to look for famous figures and interesting patterns in LeDroit Park, which is covered by enumeration districts 1-514 through 1-516.
A few things stand out. First, nearly the entire population of LeDroit Park in 1940 was black, illustrating the sharp racial segregation at the time. Second, nearly every house was packed with residents and many residents took on lodgers. Our house, a modest two-bedroom built in 1907, housed 13 people!
* * *
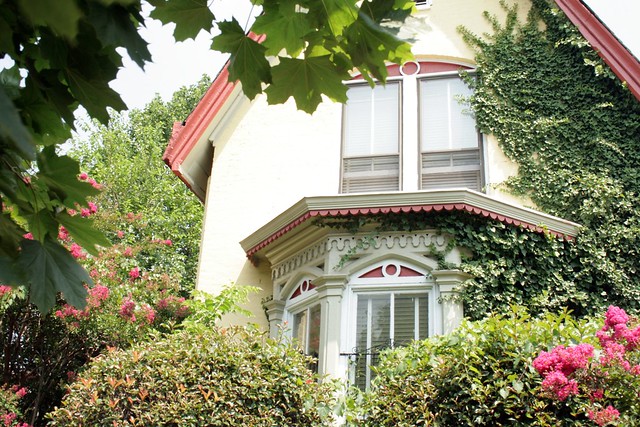
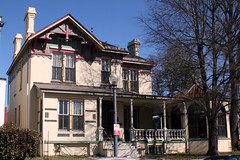
We will publish some interesting records as we find them, but let’s start off with the listing for Anna J. Cooper (née Haywood), her lodger, and her nephew, who lived at 201 T Street (pictured below). The Cooper household is listed as entries 53 – 55 in the ledger at the top of this post.

 Cooper was the principal of the M Street High School, she was an author, a feminist, and a teacher. The census only collects unambiguous personal statistics, so there is actually a longer story behind every column entry.
The first column in the snippet above states the value of her home as $20,000, a high sum compared to other LeDroit Park homes.
The 11th column lists “C8”, meaning that she received eight years of a college education. What the record doesn’t state is that she received a PhD from the Sorbonne in 1924, making her among the first black American women to receive a doctorate.
The 8th column states her age as 80 (she was actually 81) and the 13th column simply states that she was born in North Carolina. What the record doesn’t state is that she was born in North Carolina in 1858 into slavery.
The rest of the record not pictured in the above snippet states that by 1940 she was unable to work, though in reality she was likely still running a small night school.
She died in 1964 at the age of 105. The circle at 3rd and T Streets is named in her honor, she is featured on a postage stamp and on pages 26 and 27 of the U.S. passport.
Census data for LeDroit Park
In preparation for redistricting Ward 1’s ANCs, the DC Office of Planning has released block-by-block demographic data for the District. We have combined the data for the blocks that comprise LeDroit Park to create a LeDroit Park census.
Analyzing U.S. Census data for LeDroit Park proves difficult because the of the way census tracts are drawn. Our census tract, 34, combines LeDroit Park and Howard University. Dorms on the northern end of the campus, far away from LeDroit Park, account for 717 of the tract’s 4,347 residents, thus skewing tract data. Furthermore, the tract also inclues several blocks bounded by Rhode Island Avenue NW, Florida Avenue NW, and 2nd Street NW.
Fortunately, the Census Bureau provides data for each block, allowing us to combine the statistics for those blocks in LeDroit Park, while excluding the Howard University campus. In the map below, we have outlined the tract in blue and shaded the blocks for LeDroit Park in red.
View LeDroit Park Census in a larger map
Though LeDroit Park started out as an exclusively white suburban neighborhood, by 1910 the neighborhood was almost entirely black. Today, 100 years later, the neighborhood is 70% black and is continuing to diversify.

However, when looking at the numbers on a block-by-block basis, you see that the neighborhood demography, must like that of the District itself, is unevenly distributed.
The block bounded by 5th Street, T Street, 6th Street, and U Street is 53% white, the highest in the neighborhood. Likewise, the block containing the Kelly Miller public housing is 91% black, the highest percentage in the neighborhood. The block containing the arch and the Florida Avenue Baptist Church comes closest to black-white equilibrium at 44% and 49% for each group respectively.

When looking at total population numbers for each block, you see that the two most populous blocks contain Howard University dorms. The block bounded by 2nd Street, T Street, 3rd Street, and Elm Street has 382 residents and contains Slowe Hall, which houses 299 students.
The second most populous block contains the new park. However, it also contains Carver Hall, which itself houses 173 students. Certainly these blocks are big, but the fact that their population numbers are off the chart has more to do with student dorms than with any inherent difference in housing density.

Finally, when we look at housing vacancy, we see that the block bounded by 5th Street, T Street, 6th Street and U Street has 38% of its housing units vacant. We’re not sure what’s causing this number, but we suspect that the apartment building at 5th and U Streets NW boosted the vacancy rate. The building has since been finished and is fully rented.
The block with the second-highest rate of vacancy contains the now-renovated Ledroit Place condo building at 1907 3rd Street NW.

It would be interesting too look at other data, including household income, car ownership, and age distribution for the neighborhood. However, the Office of Planning’s spreadsheet only covered population numbers, racial distribution, and housing unit numbers, so those are the metrics we graphed.
DC, Now With 1.6% More People!
Next year is the decennial census, and though this ten-year period is mandated by the Constitution, the U.S. Census Bureau continues to collect detailed demographic data, including population estimates, for the other nine years.
From July 1, 2008 to July 1, 2009, the District gained 9,583 people, raising our population to 599,657, just a tad short of the tantalizing 600k mark that we haven’t seen since 1991.
That amounted to a 1.6% increase. Only four states gained more proportionally: Wyoming (2.1%), Utah (2.1%), Texas (2.0%), and Colorado (1.8%).
Increased population densities bring many advantages economically.
An increasing population expands the demand for housing, thereby securing the equity stakes of current homeowners. Detroit residents have lost small fortunes as the values of their homes have declined over the years.
With more people comes a greater demand for restaurants, bars, and stores. The more people who live withing walking distance of a commercial district, the more vibrant that commercial district becomes as there are more potential customers for the same amount of retail space.
With greater densities comes a greater demand for transit, making frequent transit service more economically viable.
Whether or not one likes living in a mid- or high-density community is really a matter of personal taste— there are certainly some downsides, too— but keep in mind that the densest Census tract in the nation is on Manhattan’s Upper East Side, a tony and desirable neighborhood.
Nevertheless, we see the District’s positive population change as a positive development overall.


Recent Comments