
How LeDroit Park’s demographics have changed since 1970
Since 2000 the census tract that includes LeDroit Park has grown more educated, more expensive, and wealthier. Meanwhile the tract’s total population held steady after decades of slow decline. While the white population has increased, the census tract is still overwhelmingly black.
Governing Magazine recently ran a story on gentrification in DC and labeled Census Tract 34, which contains LeDroit Park and Howard University, as “gentrified“. LeDroit Park has certainly changed over the years and I finally got around to compiling decennial census data from 1970 to 2010 as well as data from the American Community Survey.
Let’s start off with the biggest changes.
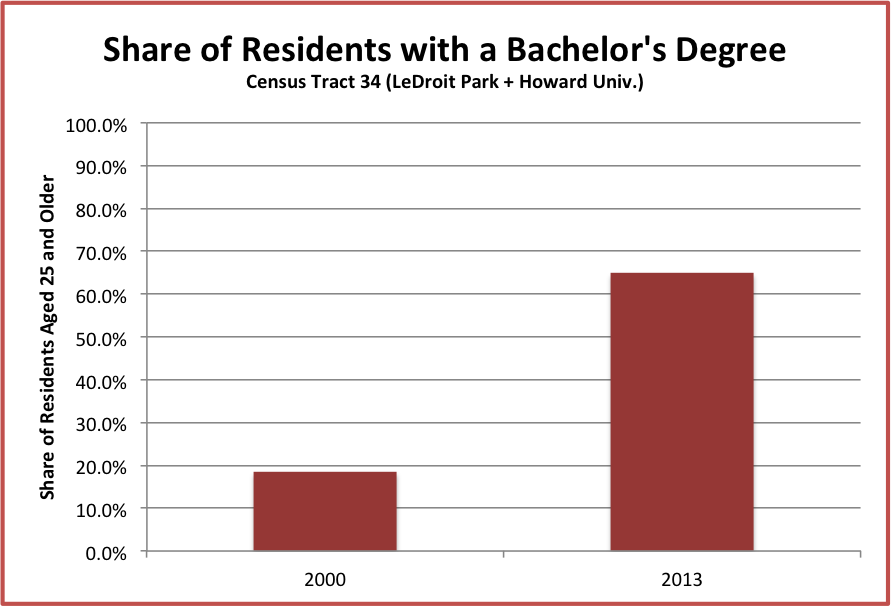
LeDroit Park is now better educated than the DC region and the nation
Data from Governing show that the share of adults age 25 and older who earned a bachelor’s degree more than doubled from 18.5% in 2000 to 64.9% in 2013. In fact the neighborhood catapulted over the regional figure (48%) and the national figure (28.8%).
Home prices fluctuate more drastically in LeDroit than in the rest of DC
Data from NeighborhoodInfoDC show that until 2004, the median sale price of single-family homes in the neighborhood moved closer to the average of the median values of all DC census tracts. The median price in LeDroit Park quintupled from 1996 to 2005, marking the greatest period of price appreciation. Though prices fell a bit from the recession, the neighborhood’s median price is slowly converging on the District-wide figure. (Disclosure: I do consulting work for the think-tank that produces NeighborhoodInfoDC)
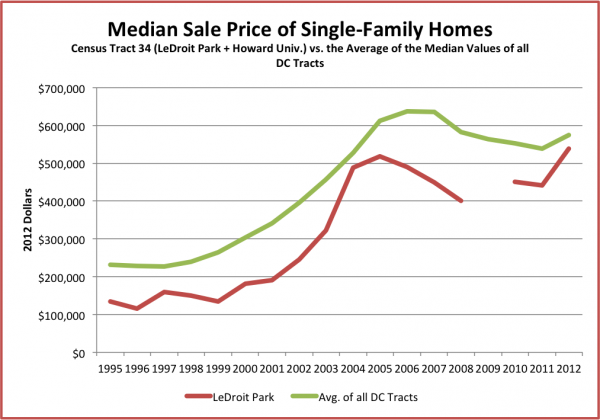
Note: 2009 data not available
Governing’s data of the median home value (both single-family homes and condos) show that housing prices nearly doubled from 2000 to 2013.

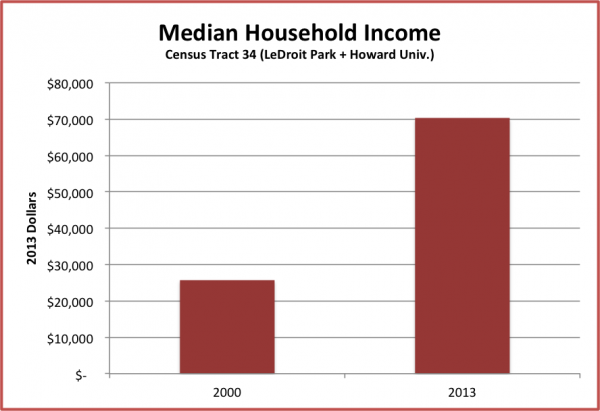
Median household income more than doubled from 2000 to 2013
(For comparison, median household income nationwide declined during this period.)
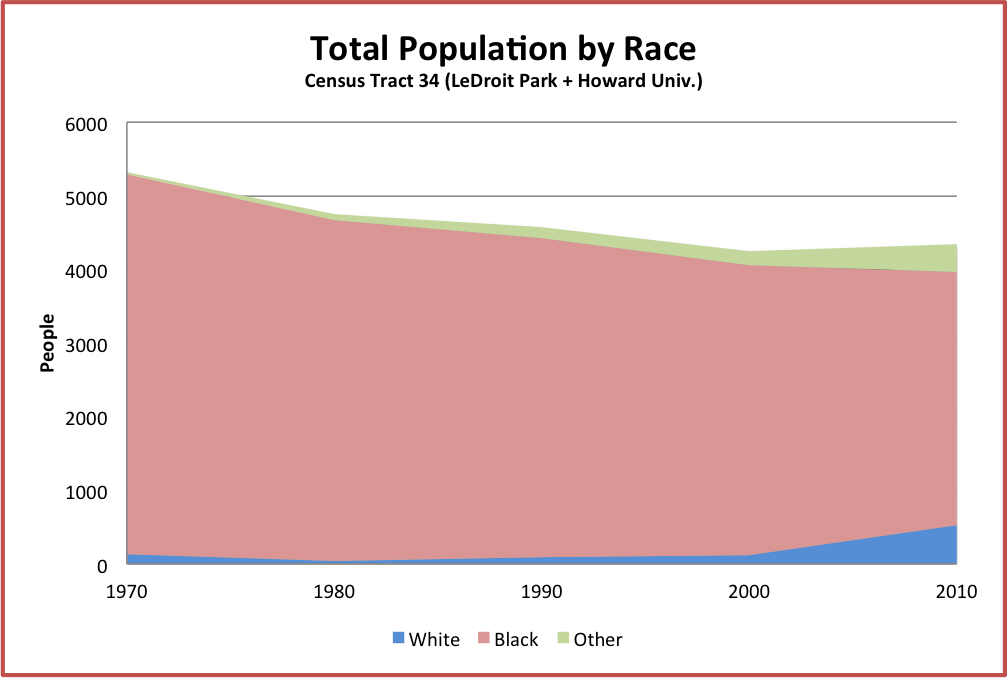
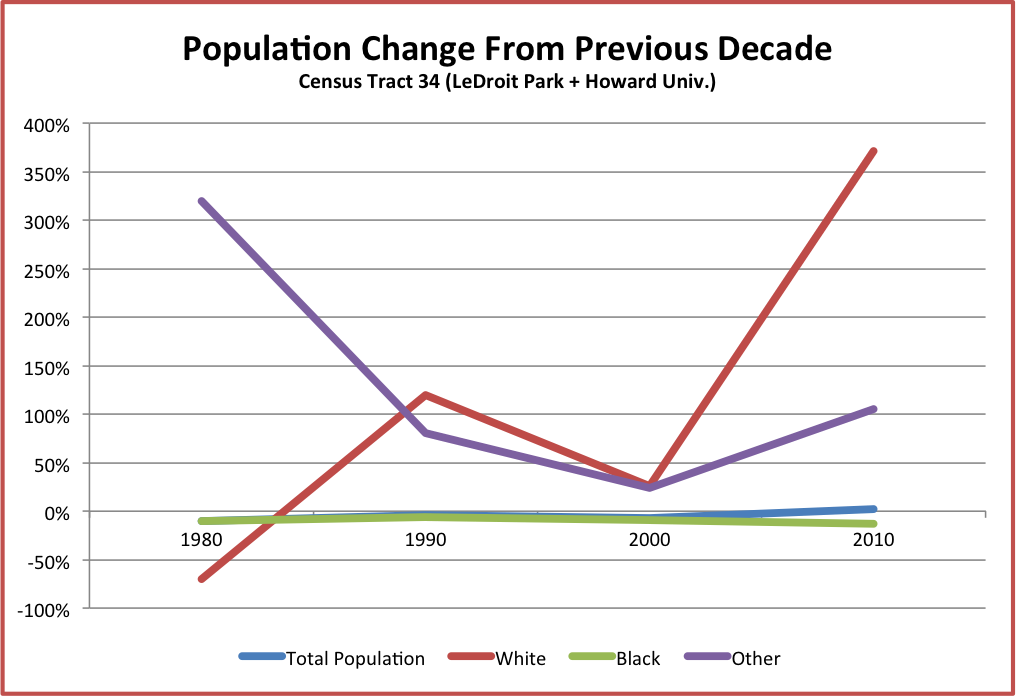
LeDroit Park is still predominantly black
The population of LeDroit Park and Howard’s campus held steady since 2000 after decades of modest decline. Though the number of whites more than tripled and number of blacks fell 13% from 2000 to 2010, our census tract is still 79% black. A few years ago I got a limited data set of the 2010 Census from the Office of Planning and was able to separate LeDroit Park figures from the rest of the census tract that lies north of W Street. Even then I found that the neighborhood was 70% black.
One popular gentrification narrative is that the process turns poorer black neighborhoods into wealthy white neighborhoods. While income and home values in LeDroit have soared, it still remains a predominantly black neighborhood.
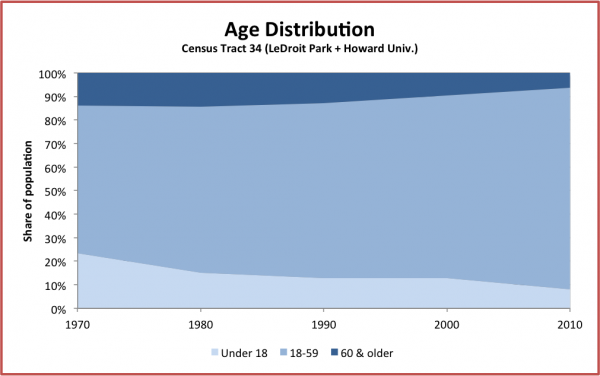
Lil’ LeDroiters are becoming scarcer
From 1970 to 2010, the population of residents under 18 tumbled from 23% of the population (1,244 children) to 8% of the population (350 children). For comparison, DC’s under-18 population in 2010 stood at 17%.
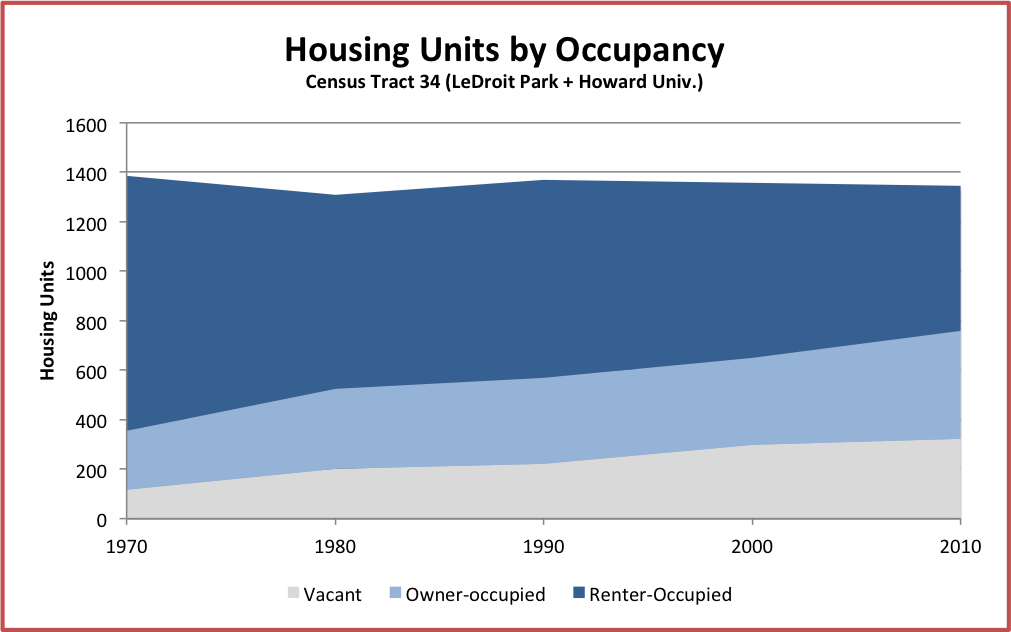
Homeownership has expanded, the housing stock has not
This was one of the more surprising facts. Despite construction of numerous infill rowhouses (especially on the 300 and 500 blocks of U Street) and despite the conversion of many one-unit rowhouses into two-unit rowhouses, the total number of housing units is slightly lower than in 1970. Also, vacancy has been rising, which contradicts what I have seen since I moved here in 2009. Perhaps the vacancy numbers were driven by the remodeling of the 161 units at Kelly Miller or perhaps Howard University dorm rooms do not count as “occupied” since many are vacant during the summer.
The definition of gentrification is a matter of great debate, but Governing defined it as any census tract that met the following criteria from the 2000 Census to the 2010 Census:
- It must start out poorer, i.e. “median household income and median home value needed to fall within the bottom 40th percentile of all tracts within a metro area at the beginning of the decade.”
- It must end up pricier and more educated, i.e. “in the top third percentile for both inflation-adjusted median home values and percentage of adults with bachelors’ degrees.”
According to Governing’s analysis, our tract, like half of the other DC tracts that met the first condition above in 2000, satisfied the second condition in 2010 and thus gentrified.
Sources:
- Longitudinal Census Bureau data (1970 – 2010) came from the US 2010 project, which used a peer-reviewed method adjust older tract data to conform to the latest tract boundaries.
- Governing, which used Census Bureau data.
- American Community Survey, a Census Bureau project that collects detailed demographic data for years between and overlapping each decennial census.
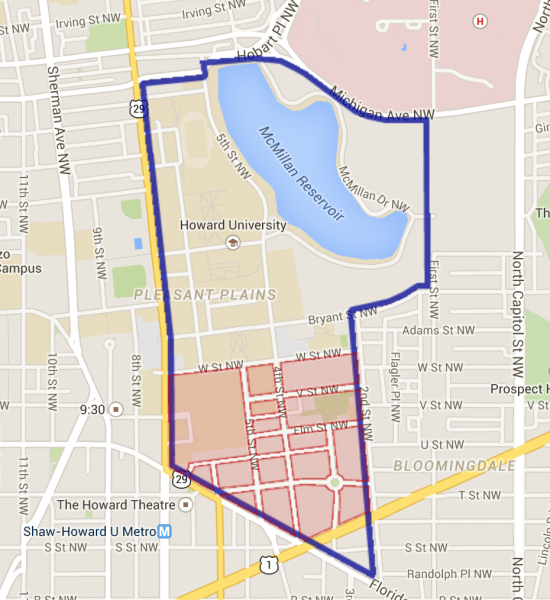
Our census tract (outlined in blue) is larger than the neighborhood and includes much of the Howard University campus.
1 Reply
Sorry, comments are closed.


Nice analysis. Good to see this level of thought on neighborhood blogs!